
ToolTicker
A public data product with AI-tool rankings, change history, market moves and transparent methodology.
Context / task
The AI software market moves faster than a user can compare individual releases and recommendation lists.
The interface had to do more than show a catalog — it needed to surface current leaders, movement and the strength of a change.
What was done
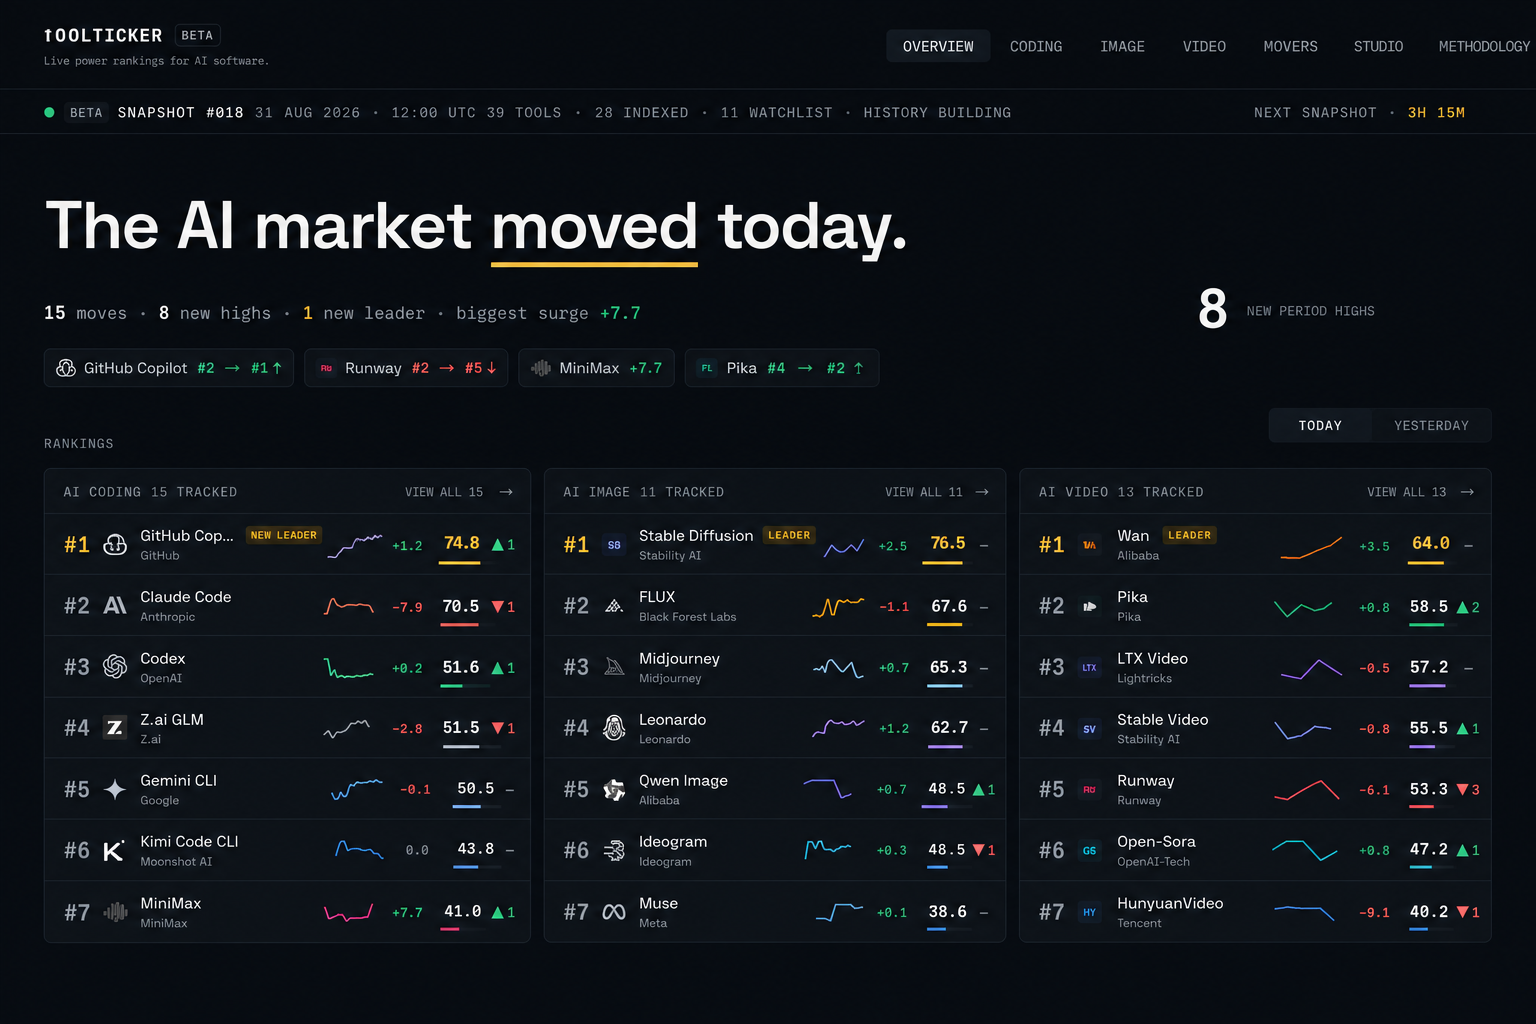
ToolTicker is built as a compact analytics terminal.
The home page opens with a fresh snapshot, then shows separate AI coding and AI image tool rankings, notable moves and a timeline of activity.
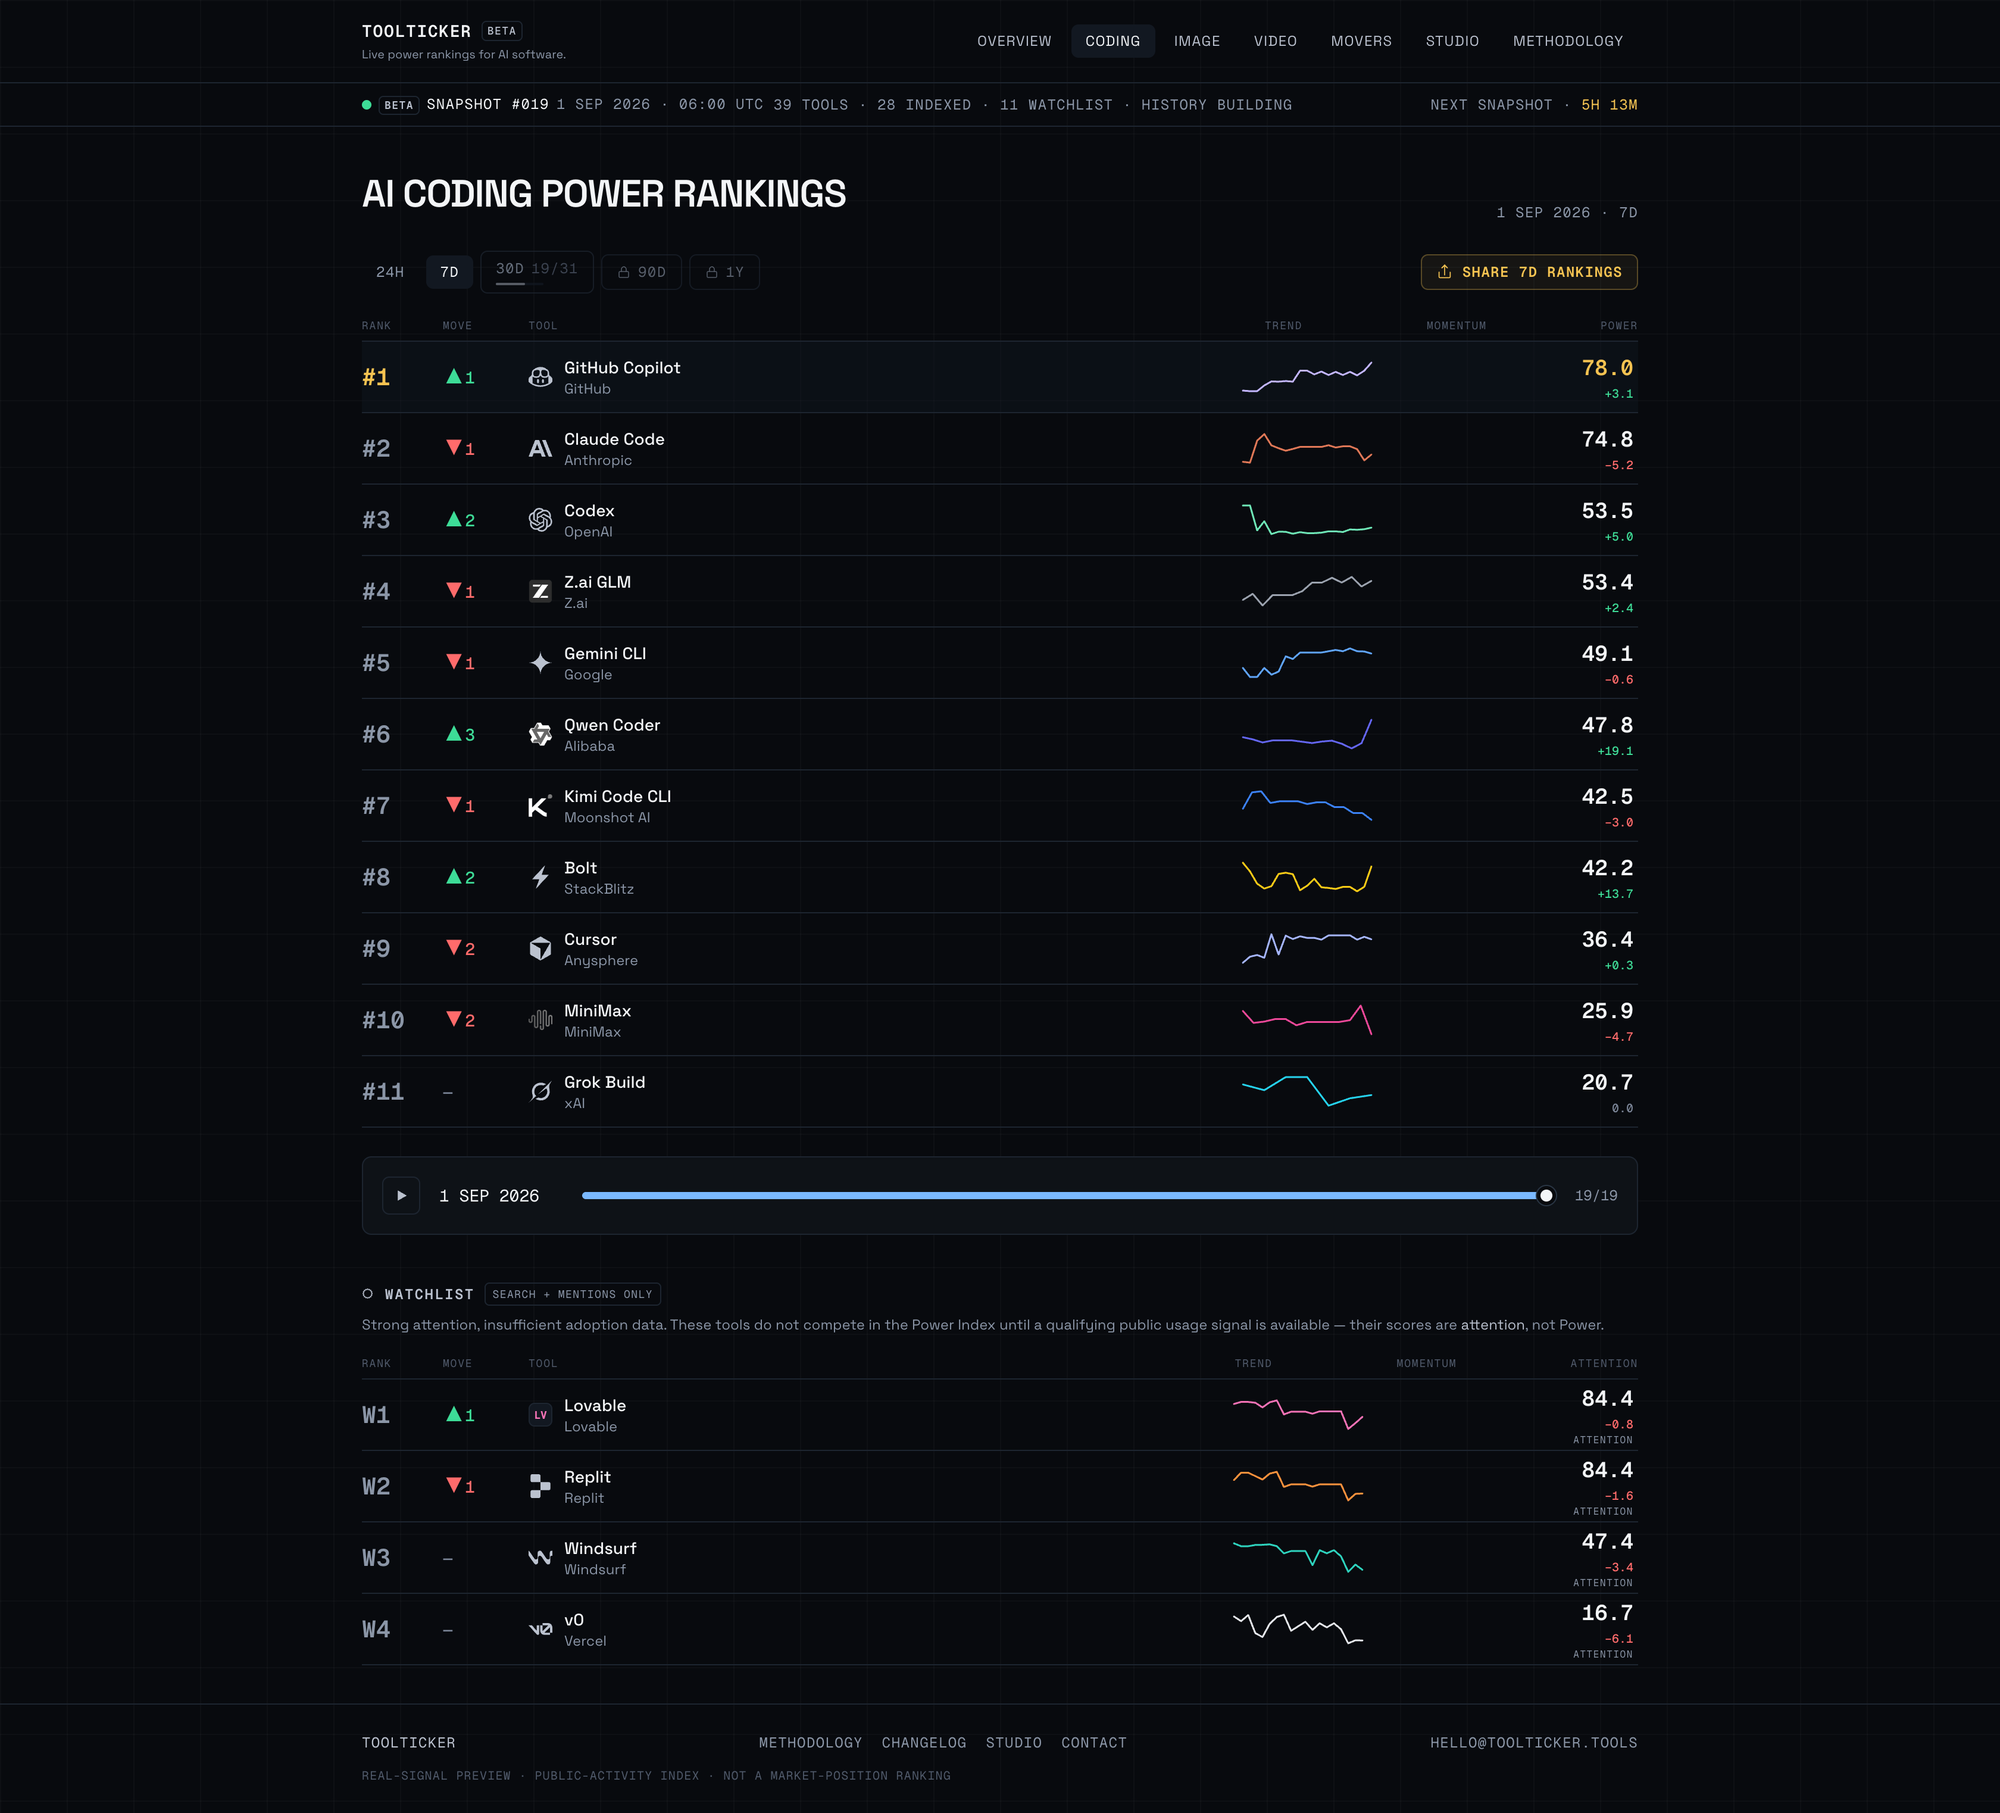
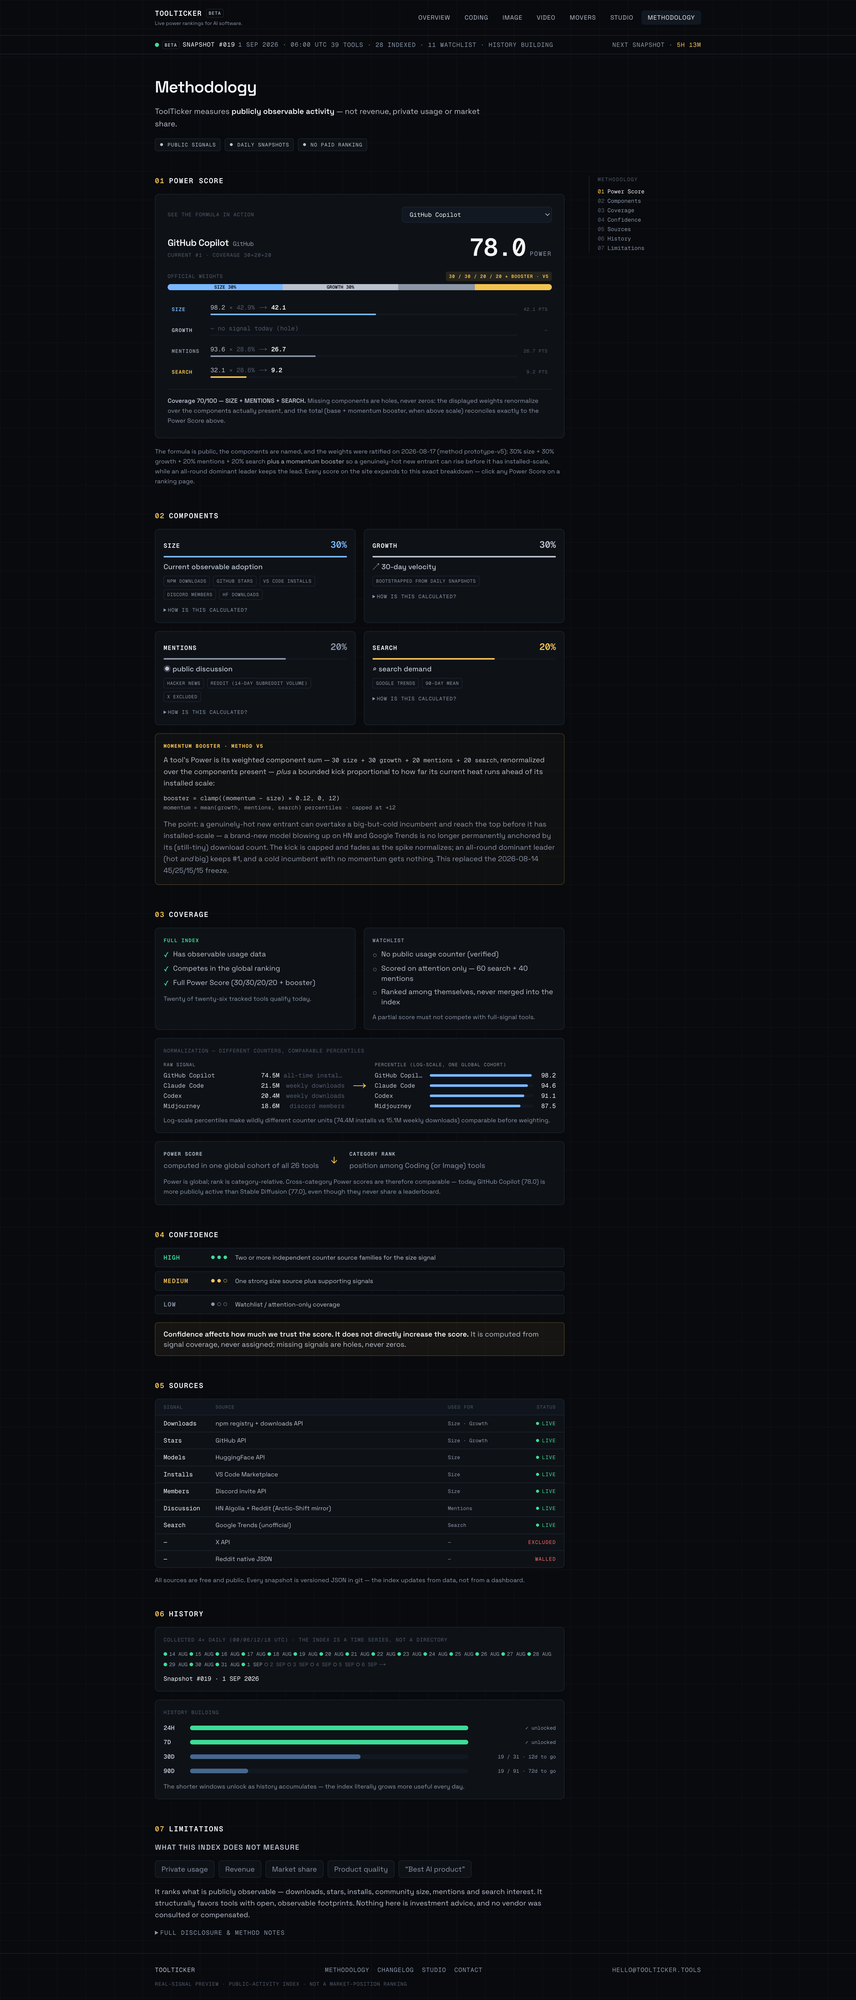
Each tool has its own route, and dedicated sections reveal categories, movers, methodology, changelog and a card studio.
Key capabilities
- updatable snapshot views
- separate coding and image tool rankings
- positions today and in the previous period
- power score and direction of change
- biggest gain, biggest drop and biggest surge
- market activity feed
- individual tool pages
- public methodology
- a card studio for preparing visual cards
Technical side
Presented as an example of a dense interface with a large volume of data, clear visual hierarchy and self-contained product logic.
The specific power-score calculation algorithm is not asserted, as it is not published in the available methodology.
Project materials
Next case
ButterflyBot
Similar task